Zigbee Network Analyzer
This guide explains how to analyze Zigbee networks using the ConBee II. The analyzer runs directly in the browser: https://phoscon.de/net/
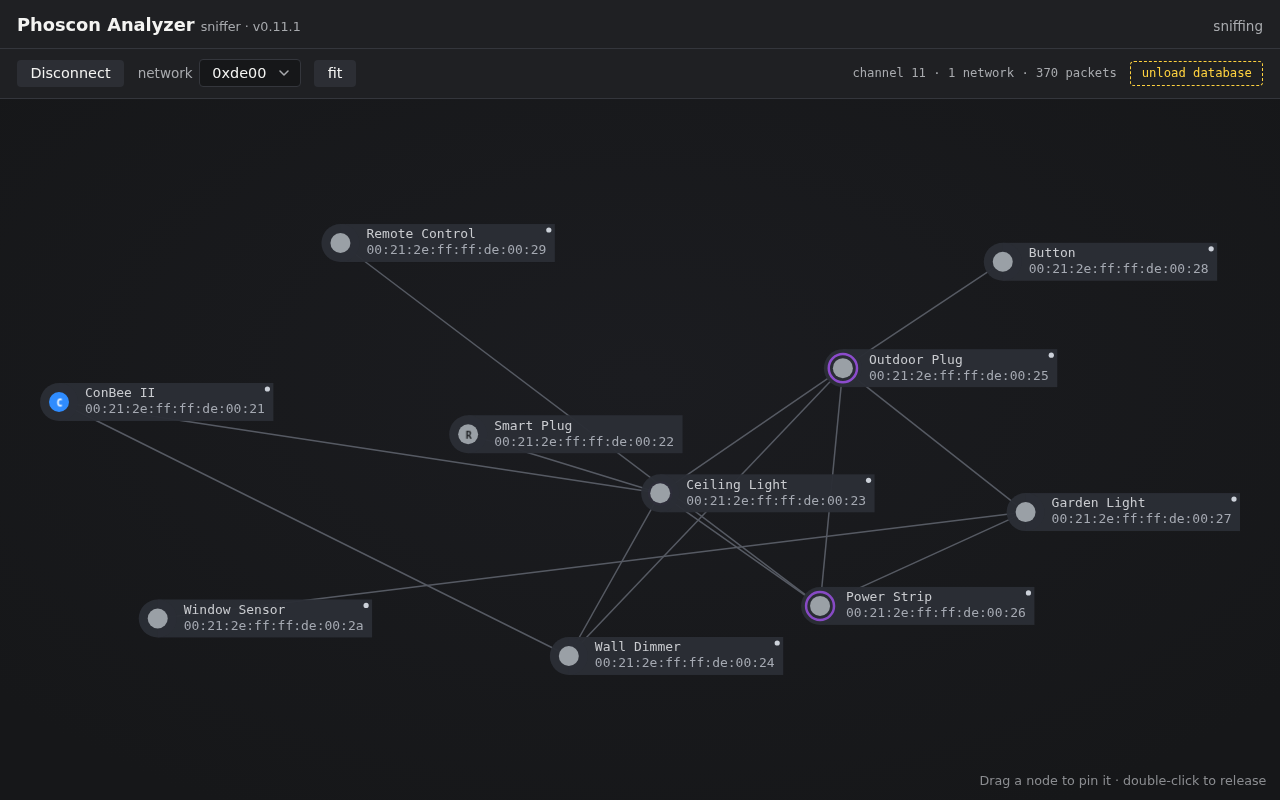
The Phoscon Analyzer makes visible what your Zigbee radio really does: all networks on the selected channel, every node and every link live in the browser.
Prerequisites
- ConBee II
- An active internet connection to start the Zigbee Network Analyzer
- Web browser Chrome, Edge, Opera, or Firefox (151 or later)
The Web Serial API protocol required for the update is supported by Chrome, Edge, Opera, and Firefox 151 or later (desktop only, not Firefox for Android). A list of supported browsers can be found here: https://developer.mozilla.org
Firmware Update
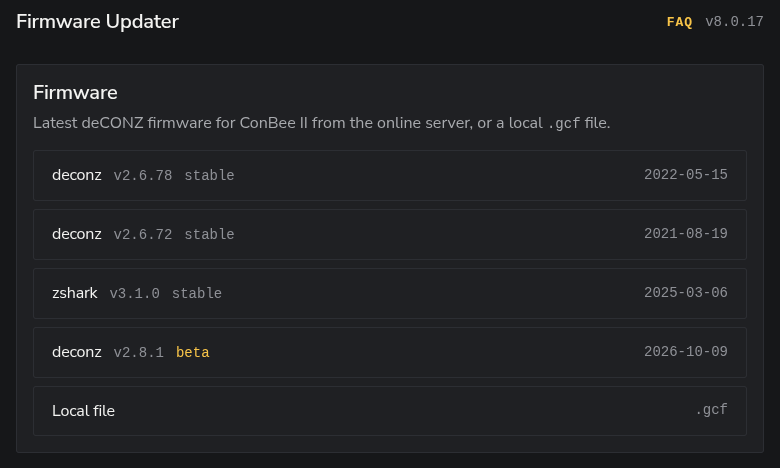
To use the ConBee II as a Network Analyzer, the current deCONZ beta firmware is recommended (at present v2.8.1 beta), because it contains the functions required by the analyzer.
Open the Online Firmware Updater and select the ConBee II. The firmware list shows the available deCONZ firmwares; the recommended current beta is marked beta:
Connect the ConBee II to a PC/laptop
Select the current deCONZ beta (in the screenshot: deconz v2.8.1 beta)
Perform the update
Done!
Start Analyzer
Plug the ConBee II into a free USB port of your computer.
Open the website https://phoscon.de/net/.
Select the Zigbee channel you want to analyze. Most Zigbee devices operate on channels 11, 15, 20, or 25. The correct channel setting can often be found in your Zigbee gateway app.
Establish connection: Click the
Connect
button and connect the plugged-in ConBee II. The Zigbee Network Analyzer will start and record all Zigbee-compliant devices and connections on the selected channel.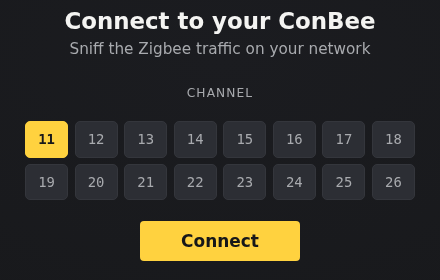
Analyzer Details
The Zigbee Analyzer displays the following information:
- Network: Select the Network ID, also known as PANID
- Fit: Displays the entire network in view
- Load Database: Custom device names assigned in the network can be
displayed. Currently, this feature is only supported by deCONZ.
- deCONZ: Drag and drop the database file
zll.db
(deCONZ) or the backup file.dat
into the window
- deCONZ: Drag and drop the database file
- Nodes:
- Coordinator (C)
- Router (R)
- End device (sensor, switch, remote control)
- Lines and colors:
- Gray: A connection exists between the devices
- Yellow: A radio packet is currently being transmitted between two nodes (unicast). The packet is actually sent and received via the depicted nodes
- Violet: A broadcast packet was just received, a message sent to all participants at once. Broadcasts appear as a briefly glowing ring around a node and do not create lines, because they have no single destination
In addition, you can:
- click a node: a detail panel opens, showing the device (name, model and manufacturer, if loaded from the database) and its connections, marked with arrows (-> sent, <- received) and the number of radio packets per connection
- drag a node with the mouse: it is pinned in place and no longer moved by the automatic layout; a double-click releases the pin
- watch the status bar: the top right shows the selected channel, the
number of detected networks and the number of observed radio packets,
for example
channel 11 · 1 network · 370 packets
The analyzer evaluates only the radio frame headers: who talks to whom over which path. The actual message content remains encrypted (AES-CCM) and is not displayed. Everything on the selected channel is captured, not only your own network.